Every 5 days
Sentinel-2 photographs every place on Earth about every 5 days, for free.
Every 5 days
Sentinel-2 photographs every place on Earth about every 5 days, for free.
10 m per pixel
But at that resolution a house is one or two pixels, and small roads disappear.
Every few years
Sub-metre aerial imagery is sharp, but it is captured once every few years and can't be downloaded freely in bulk.
About 2.4 m per pixel
So we sharpen the free Sentinel-2 L2A images of India 4x, to about 2.4 m per pixel.
10 m per pixel
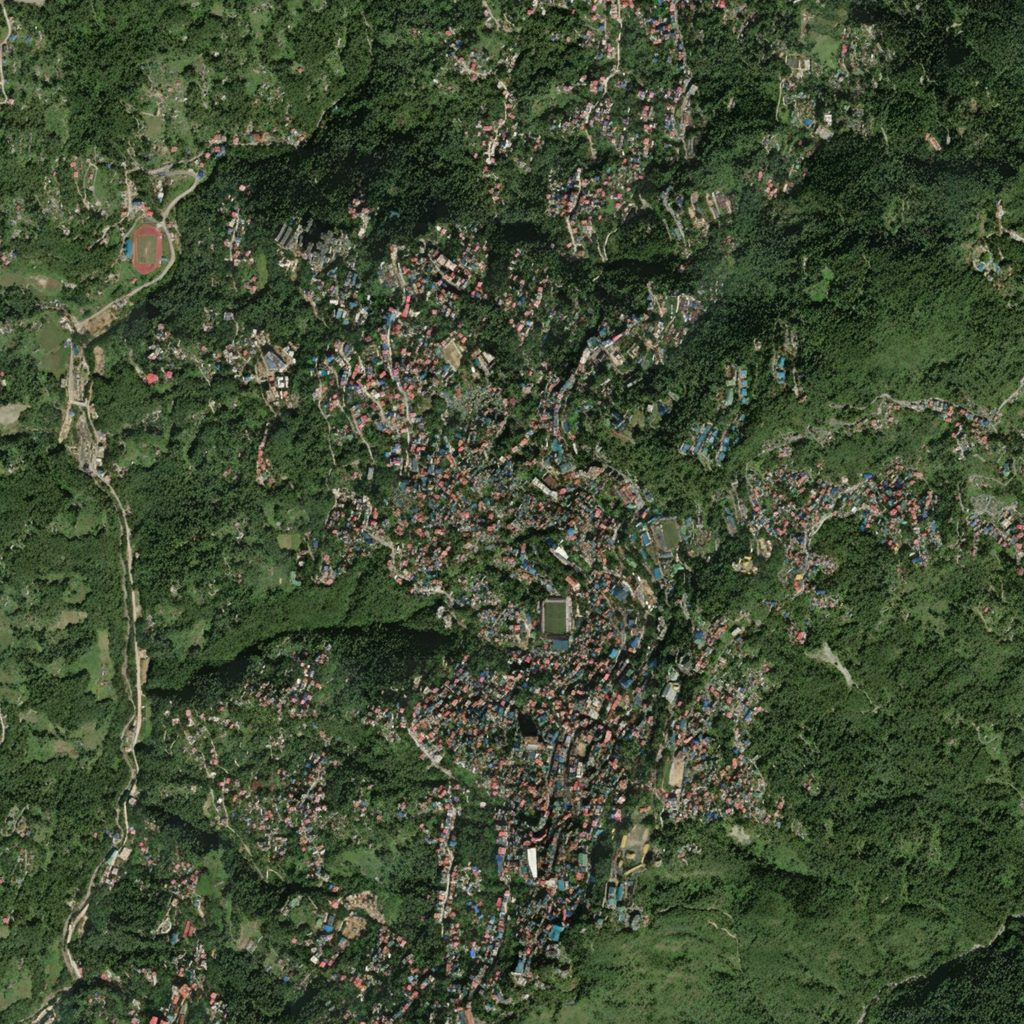
Eight Sentinel-2 Level-2A images (atmospherically corrected) of the same place, from eight different dates, are stacked into one 24-channel input. Combining dates lets the network see past haze or small clouds on any one of them, and cloudy frames are rejected automatically.
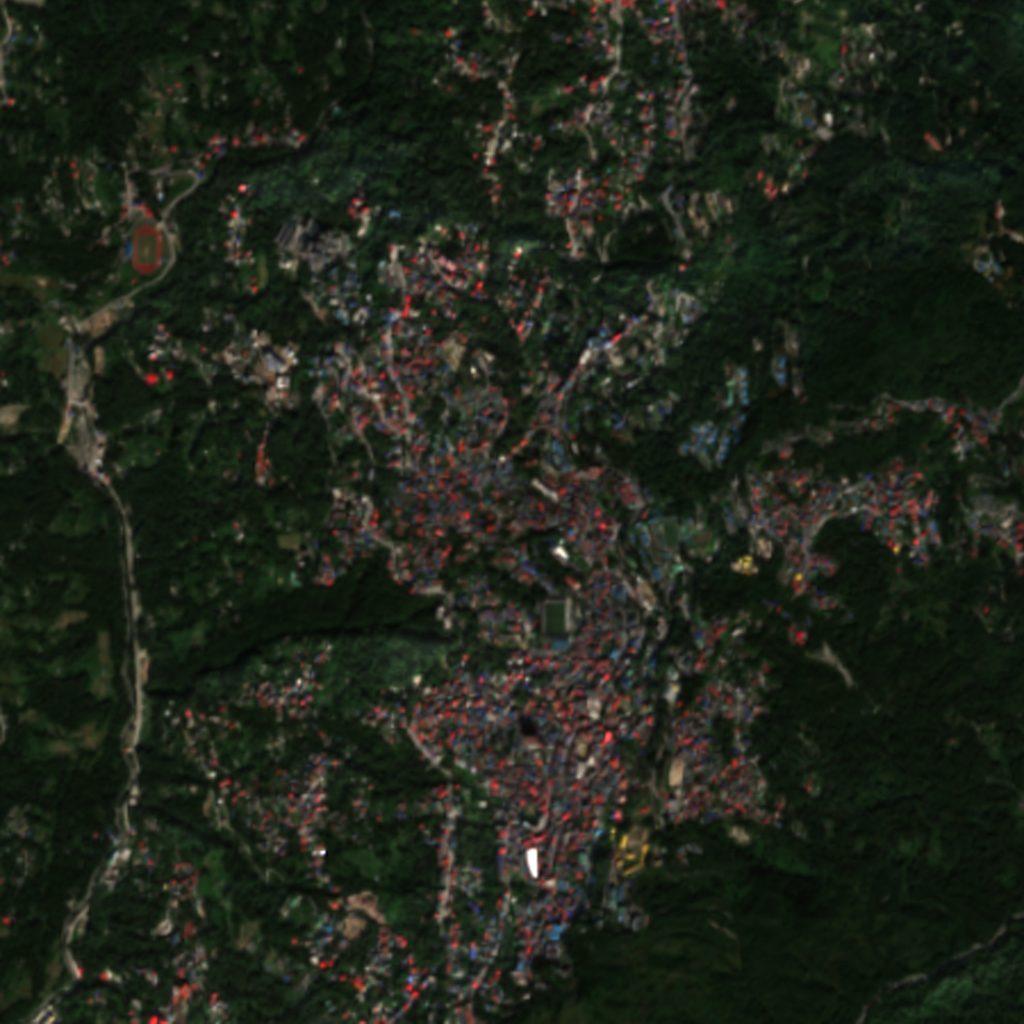
A 32 × 32 tile at 10 m per pixel becomes 128 × 128, four times more pixels in each direction, at about 2.4 m per pixel. Buildings, roads and field boundaries become visible: here you can pick out the running track, the football ground and the roads threading along the ridge.
During training, a second network scores every pixel of the output against the eight input images, so detail the satellite data doesn't support is penalised.
Drag across the image to compare the Sentinel-2 image with the output. Tested on 7 places in India the model never saw in training:
Looks realistic (LPIPS, lower is better)
Edges in the right place (Edge-F1, higher is better)
The output is a prediction, not real 2 m imagery. Fine detail can be wrong, so check it before using it for anything safety-critical.
ESRGAN's generator in its Real-ESRGAN form, adapted to multiple satellite images by the Allen Institute for AI's Satlas project, then fine-tuned on India.
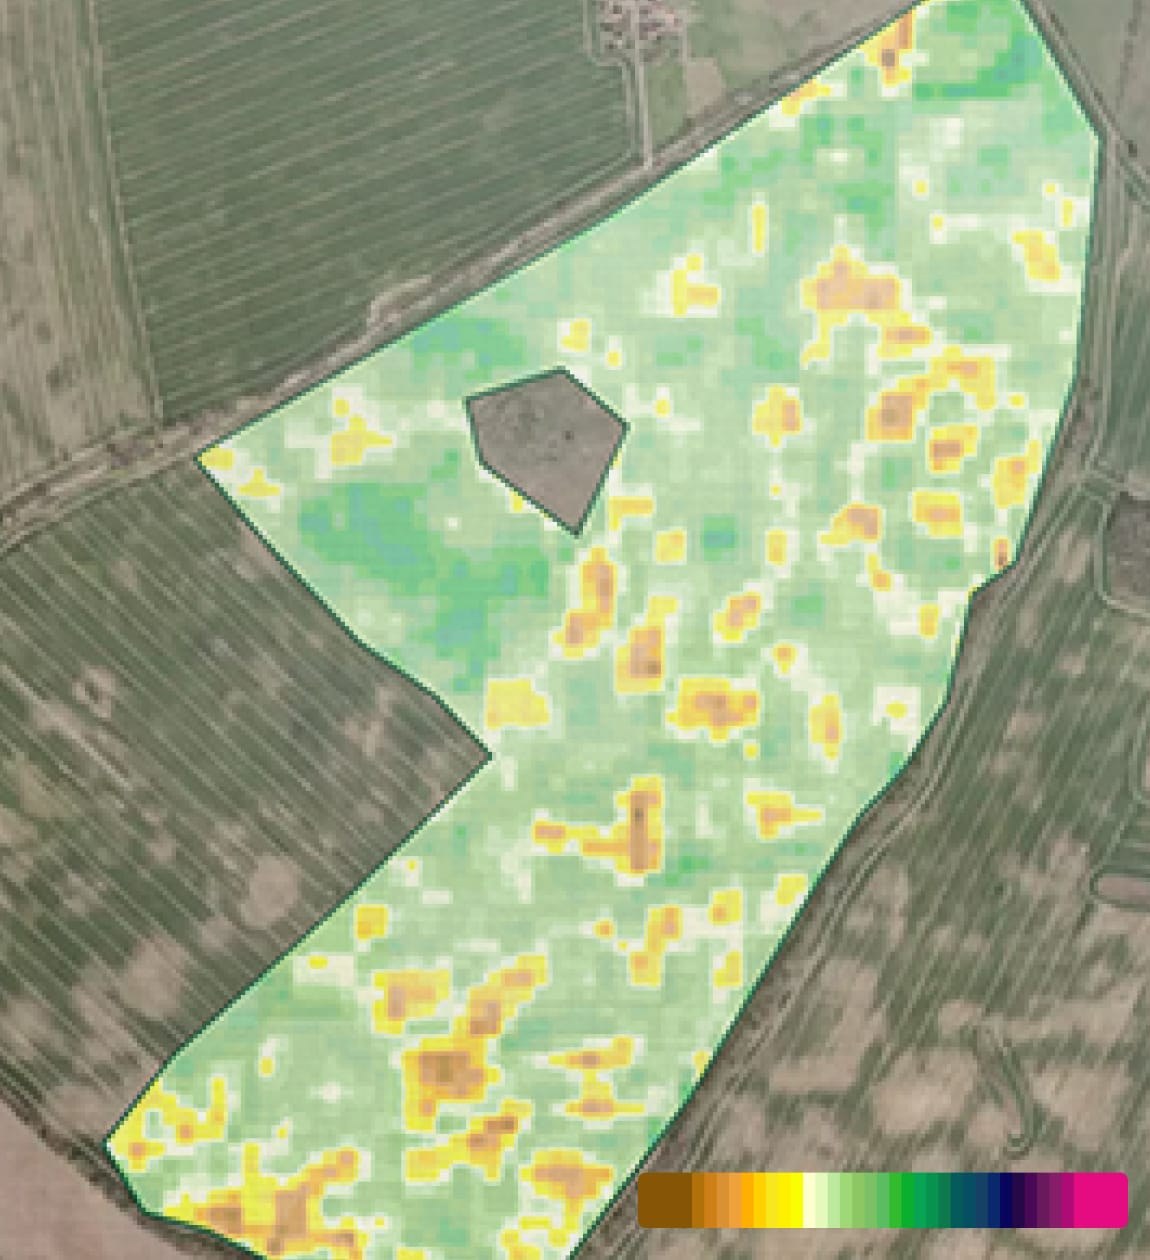
Monitor crop health, vegetation conditions and field changes using satellite imagery and spectral analysis.
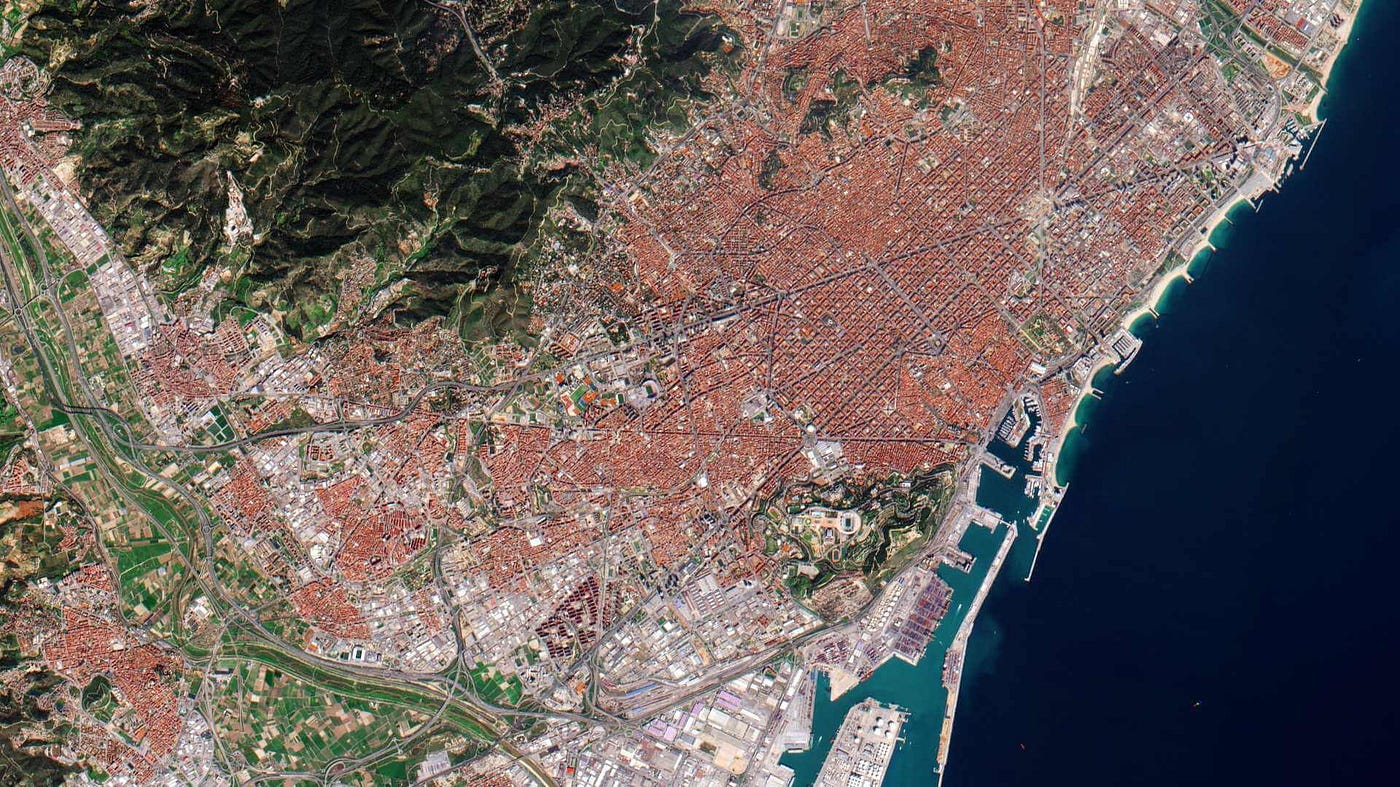
Analyze urban growth, infrastructure, land use and changes in built-up areas through satellite imagery.
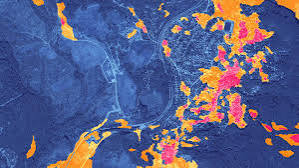
Assess affected regions using before-and-after satellite imagery to detect floods, damage and disaster impacts.